Abstract
Introduction:Multiple Myeloma (MM) is the malignant neoplasm of plasma cells and is often characterized by the production of large amounts of non-functional, monoclonal immunoglobulins (M spike) that serve as a surrogate for tumor burden and treatment response. Currently, the gold standard for monitoring response status is serum and urine protein electrophoresis (SPEP and UPEP, respectively), which quantify the M spike. Unfortunately, the turnaround time for these tests is not immediate; SPEP is ~3 days and UPEP ~7 days. Waiting for news on chemotherapeutic response is a significant psychological stressor for cancer patients and their families, and moreover leads to uncertainty when a clinician is face-to-face with a patient and PEP data are not yet available. Currently the lack of a validated, inexpensive, same-day point-of-care response assessment represents an unmet need. One such test may be the gamma gap (GG). The GG is the calculated difference between a patient's total serum protein and albumin. In patients with a substantial serum M-spike, the GG is typically elevated since excess myeloma-derived immunoglobulins elevate total protein but not albumin. Measurements of both total protein and albumin can be can be obtained from a standard comprehensive metabolic profile (CMP) or equivalent within 1 hour after blood draw. We hypothesized that the GG is a reliable indicator of disease burden and therapeutic response, and can be used as a surrogate point-of-care test for assessing response status in myeloma patients while awaiting SPEP results.
Methods: A retrospective chart review study was performed. Patients were included in the study if they met the following criteria: diagnosed between 2000 and 2015 at the Duke Healthcare system, had MM with detectable M spike either undergoing treatment (including relapsed bone marrow transplant patients) or surveillance only, and had both an SPEP and a complete metabolic panel (CMP, including albumin and total protein drawn within 2 weeks of each other) . Patients were excluded if they had a concurrent second malignancy, did not have SPEP and/or CMP for specific timepoints, had light chain disease (because these will not produce an M spike), or were diagnosed before 2000. The sample size was calculated at 200 patients.
We assessed patient data at three timepoints: at the beginning of treatment, midway (halfway through the total number of cycles received for a given treatment strategy), and at the end of a given line of treatment. Treatment responses were defined using standard IMWG response criteria. To assess the relationship between the GG and M-spike, formulas were extracted using a linear regression model and Pearson's correlation coefficients were calculated. To evaluate the relationship between GG and treatment response, an ordinal logit regression model was employed.
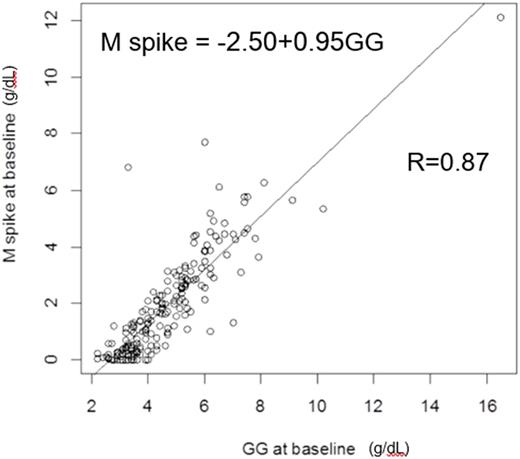
Results: A total of 693 patients were screened. Manual chart review was performed on 349 patients: 200 patients were included in the final analysis and 149 were excluded based on the exclusion criteria. We found that the GG is highly correlated with the serum M-spike at the beginning of treatment, with a correlation coefficient of 0.87 (fitted linear model: M-spike=-2.50+0.95GG) (Figure 1). Similarly, at the midpoint of therapy, GG and M-spike are highly correlated, with a correlation coefficient of 0.84 (fitted linear model: M-spike=-2.33+0.88GG). Importantly, by fitting the logit model, GG is also a significant predictor of treatment response at midpoint, with a p-value of <0.00001. Finally, the GG and M-spike are highly correlated at the end of therapy, with a correlation coefficient of 0.88 (fitted linear model: M-spike=-2.38+0.90GG). Again, GG is also a significant predictor of treatment response at the end of treatment with a p-value of <0.00001.
Conclusion: These data suggest that the GG is an accurate predictor of both disease burden as well as treatment responses in patients with a detectable M spike. Importantly, this demonstrates that the GG may be comfortably used by physicians at the bedside as an indicator of treatment response, which can lighten a patient's burden when waiting for SPEP/UPEP. Furthermore, our formulas may be used at the bedside for the calculation of M spike. Our study has important implications in our care of patients with MM.
No relevant conflicts of interest to declare.
Author notes
Asterisk with author names denotes non-ASH members.


This feature is available to Subscribers Only
Sign In or Create an Account Close Modal